

Popular searches
- OASSAY Water Purifier Bottle
- Cartridage
O
Skip to contentExplore what our purifier is designed to capture, how each stage works, and what independent testing measured.
Explore the results ↓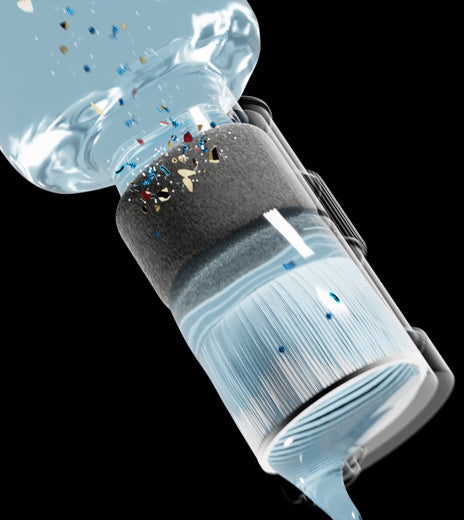

One of the world's most trusted testing and certification labs.

leading global testing, inspection, and certification company.

Universities and biotech companies to support internal data testing.
The carbon layer adsorbs larger particles and selected dissolved substances, including organic contaminants, heavy metals, free chlorine, and calcium and magnesium ions associated with water hardness.
A fine, interwoven membrane forms a physical barrier. It captures bacteria, parasite cysts and oocysts, fine particles and viruses through pore screening, diffusion-driven contact and surface-charge attraction.
More than 95% of measured pores fall within 0.03–0.04 μm. The report gives an average pore diameter of 0.0386 μm and a most frequent diameter of 0.0388 μm.
View pore-size analysis ↗
Together, the fine-pore distribution, winding fiber network and charged surface allow the membrane to capture most viruses despite their much smaller physical size. The challenge results below put this filtration performance in numbers.
LRV = log₁₀ (influent concentration ÷ filtrate concentration). A 6-log reduction means one millionth of the starting concentration remains; a 7-log reduction means one ten-millionth remains.
The test uses a very high MS2 concentration: 2.0 × 10⁶ PFU/mL—thousands to millions of times higher than typical source-water virus levels.
After a cumulative 1000 mL, Cartridge 1 measured 0.2 PFU/mL and Cartridge 2 measured 0.4 PFU/mL—removal of 99.99999% and 99.99998%.
A 1000 mL challenge at this concentration contains about 2.0 × 10⁹ PFU. If real water had a virus concentration 1,000 times lower, the same virus load would equal about 1,000 L. So this test can be read as a virus-load equivalent of at least ~1,000 L of contaminated source water.
This is a stress test of virus removal, not a rated cartridge lifetime. Actual life also depends on carbon capacity, water quality, flow rate, and storage conditions.
For your health, we recommend replacing the cartridge at 500 L or six months from first use, whichever comes first.
After use, keep the cartridge clean and store it as directed.
Water with more sediment or dissolved contaminants may use filter capacity sooner.
A used cartridge remains damp. Clean and store it according to the product instructions.
Use the 500 L or six-month interval as your guide, whichever comes first.
NBF25-0014359-01 · Removal rate: Total coliforms 99.999%; MS2 bacteriophage 99.999%; polystyrene microspheres(3 μm) 99.989%
NBF26-0023230-01 · Removal rate: Natural river-water total plate count 99.999%; total coliforms 99.999%; microplastic particles(<1 μm) 99.42%
All evaluate samples submitted by the applicant complied with NSF/ANSI/CAN 372:2024 Drinking Water System Components - Lead Content section 3.1.
MS2 Bacteriophage Filtration Test Results · Removal rate: MS2 Bacteriophage 99.99999%
OASSAY_2604_Pore Size Analysis Report of Membrane · Average pore diameter: 0.0386 μm; Most frequent diameter: 0.0388 μm
Test results relate to the samples, methods and conditions stated in each report.


